Error in getverticeshr.estUD(x[[i]], percent, ida = names(x)[i], unin,: The grid is too small to allow the estimation of home-range. You should rerun kernelUD with a larger extent parameter
Well, I'll try to explain this and solve it. First of all, this error occurs in the workflow to obtain polygons from a KDE volume, which is a common procedure in home range analysis.
In the first four steps of the following code, I simulate a dataset, which will represent the spatial position of two individuals.
1 2 3 4 5 6 7 8 9 10 11 12 13 14 15 16 17 18 19 20 21 22 23 24 25 | # -*- coding: utf-8 -*- # Author: Irbin B. Llanqui #""" # Language: R script # This is a temporary script file. #""" # 1. Packages library(adehabitatHR) # Package for spatal analysis # 2. Empty Dataframe points <- data.frame(ID = double()) XY_cor <- data.frame(X = double(), Y = double()) # 3. Assigning values (this will be our spatial coordinates) set.seed(17) for(i in c(1:100)){ if(i >= 50){points[i, 1] <- 1} else {points[i, 1] <- 2} XY_cor[i, 1] <- runif(1, 0, 100) XY_cor[i, 2] <- runif(1, 0, 100)} # 4. Transform to SpatialDataframe coordinates(points) <- XY_cor[, c("X", "Y")] class(points) |
Now, I will estimate the kernel density using those spatial points.
1 2 3 4 5 6 7 8 9 10 11 12 13 14 15 16 17 18 19 20 21 22 23 24 25 26 27 28 | # 5. Domain x <- seq(0, 100, by=1.) # resolution is the pixel size you desire y <- seq(0, 100, by=1.) xy <- expand.grid(x=x,y=y) coordinates(xy) <- ~x+y gridded(xy) <- TRUE class(xy) # 6. Kernel Density kud_points <- kernelUD(points, h = "href", grid = xy) image(kud_points) # 7. Get the Volum vud_points <- getvolumeUD(kud_points) # 8. Get contour levels <- c(50, 75, 95) list <- vector(mode="list", length = 2) list[[1]] <- as.image.SpatialGridDataFrame(vud_points[[1]]) list[[2]] <- as.image.SpatialGridDataFrame(vud_points[[2]]) # 9. Plot par(mfrow = c(2, 1)) image(vud_points[[1]]) contour(list[[1]], add=TRUE, levels=levels) image(vud_points[[2]]) contour(list[[2]], add=TRUE, levels=levels) |
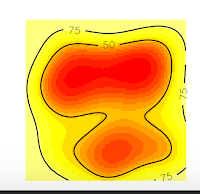
And we obtain these nice plots. Now, we want to extract the contour lines at 75% of probability density. For that, we will use the function to get vertices as the following code:

1 2 3 4 | # 10. Get vertices (Will be an Error) vkde_points <- getverticeshr(kud_points, percent = 75, unin = 'm', unout='m2') plot(vkde_points) |
And we will get an ERROR!! Specifically, we will obtain the error I introduced at the beginning of this post.
Error in getverticeshr.estUD(x[[i]], percent, ida = names(x)[i], unin,: The grid is too small to allow the estimation of home-range. You should rerun kernelUD with a larger extent parameter
But why this happened? If you are a shrewd observer, you'll notice in the above plots that, the contour line at 75% is cut, and our domain doesn't include it. So, that is the reason for the error, is that R can't estimate the vertices of the contour line at 75% precisely because they are no in the domain, they were not computed. On the contrary, the contour line at 50% is entirely inside the domain, so if we ask for this vertices, we won't have any error.
1 2 3 4 | # 10. Get vertices (Will be an Error) vkde_points <- getverticeshr(kud_points, percent = 50, unin = 'm', unout='m2') plot(vkde_points) |
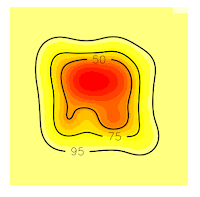
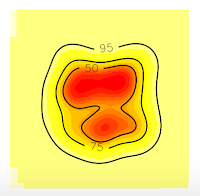
Now, if we want to extract 75% contour lines without an error, we only need to increase the grid in order to cover all the contour lines. In this case, I will increase the grid at 50 (see the item # 5. Domain x <- seq(-50, 150, by=1.) y <- seq(-50, 150, by=1.))
1 2 3 4 5 6 7 8 9 10 11 12 13 14 15 16 17 18 19 20 21 22 23 24 25 26 27 28 29 30 31 32 33 | # 5. Domain x <- seq(-50, 150, by=1.) # resolution is the pixel size you desire y <- seq(-50, 150, by=1.) xy <- expand.grid(x=x,y=y) coordinates(xy) <- ~x+y gridded(xy) <- TRUE class(xy) # 6. Kernel Density kud_points <- kernelUD(points, h = "href", grid = xy) image(kud_points) # 7. Get the Volum vud_points <- getvolumeUD(kud_points) # 8. Get contour levels <- c(50, 75, 95) list <- vector(mode="list", length = 2) list[[1]] <- as.image.SpatialGridDataFrame(vud_points[[1]]) list[[2]] <- as.image.SpatialGridDataFrame(vud_points[[2]]) # 9. Plot par(mfrow = c(2, 1)) image(vud_points[[1]]) contour(list[[1]], add=TRUE, levels=levels) image(vud_points[[2]]) contour(list[[2]], add=TRUE, levels=levels) # 10. Get vertices (Will be an Error) vkde_points <- getverticeshr(kud_points, percent = 75, unin = 'm', unout='m2') plot(vkde_points) |


Now, all the contour lines are inside the grid, so we'll no see the error message. And that's all.

Hi, thanks for this very insightful post, I was also having the same problem and this somehow fixes it, but now I have another error when I run the getverticeshr command : "Error in re[[i]] : subscript out of bounds". Do you have any solution for this?
ReplyDeleteI have used your code to expand the grid but fitted to my coordinates range.
Thanks!
Hi, I'm so sorry for my delayed answer. I hope you was able to solve your problem. If not, perhaps you could share with me a reproducible example of your error. Also, you can email me. Cheers!
DeleteThis comment has been removed by the author.
ReplyDelete