Error in getverticeshr.estUD(x[[i]], percent, ida = names(x)[i], unin,: The grid is too small to allow the estimation of home-range. You should rerun kernelUD with a larger extent parameter
Well, I'll try to explain this and solve it. First of all, this error occurs in the workflow to obtain polygons from a KDE volume, which is a common procedure in home range analysis.
In the first four steps of the following code, I simulate a dataset, which will represent the spatial position of two individuals.
1 2 3 4 5 6 7 8 9 10 11 12 13 14 15 16 17 18 19 20 21 22 23 24 25 | # -*- coding: utf-8 -*- # Author: Irbin B. Llanqui #""" # Language: R script # This is a temporary script file. #""" # 1. Packages library(adehabitatHR) # Package for spatal analysis # 2. Empty Dataframe points <- data.frame(ID = double()) XY_cor <- data.frame(X = double(), Y = double()) # 3. Assigning values (this will be our spatial coordinates) set.seed(17) for(i in c(1:100)){ if(i >= 50){points[i, 1] <- 1} else {points[i, 1] <- 2} XY_cor[i, 1] <- runif(1, 0, 100) XY_cor[i, 2] <- runif(1, 0, 100)} # 4. Transform to SpatialDataframe coordinates(points) <- XY_cor[, c("X", "Y")] class(points) |
Now, I will estimate the kernel density using those spatial points.
1 2 3 4 5 6 7 8 9 10 11 12 13 14 15 16 17 18 19 20 21 22 23 24 25 26 27 28 | # 5. Domain x <- seq(0, 100, by=1.) # resolution is the pixel size you desire y <- seq(0, 100, by=1.) xy <- expand.grid(x=x,y=y) coordinates(xy) <- ~x+y gridded(xy) <- TRUE class(xy) # 6. Kernel Density kud_points <- kernelUD(points, h = "href", grid = xy) image(kud_points) # 7. Get the Volum vud_points <- getvolumeUD(kud_points) # 8. Get contour levels <- c(50, 75, 95) list <- vector(mode="list", length = 2) list[[1]] <- as.image.SpatialGridDataFrame(vud_points[[1]]) list[[2]] <- as.image.SpatialGridDataFrame(vud_points[[2]]) # 9. Plot par(mfrow = c(2, 1)) image(vud_points[[1]]) contour(list[[1]], add=TRUE, levels=levels) image(vud_points[[2]]) contour(list[[2]], add=TRUE, levels=levels) |
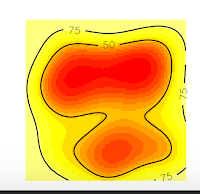
And we obtain these nice plots. Now, we want to extract the contour lines at 75% of probability density. For that, we will use the function to get vertices as the following code:

1 2 3 4 | # 10. Get vertices (Will be an Error) vkde_points <- getverticeshr(kud_points, percent = 75, unin = 'm', unout='m2') plot(vkde_points) |
And we will get an ERROR!! Specifically, we will obtain the error I introduced at the beginning of this post.
Error in getverticeshr.estUD(x[[i]], percent, ida = names(x)[i], unin,: The grid is too small to allow the estimation of home-range. You should rerun kernelUD with a larger extent parameter
But why this happened? If you are a shrewd observer, you'll notice in the above plots that, the contour line at 75% is cut, and our domain doesn't include it. So, that is the reason for the error, is that R can't estimate the vertices of the contour line at 75% precisely because they are no in the domain, they were not computed. On the contrary, the contour line at 50% is entirely inside the domain, so if we ask for this vertices, we won't have any error.
1 2 3 4 | # 10. Get vertices (Will be an Error) vkde_points <- getverticeshr(kud_points, percent = 50, unin = 'm', unout='m2') plot(vkde_points) |
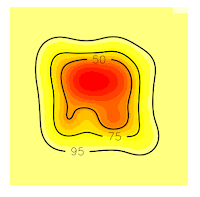
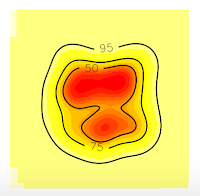
Now, if we want to extract 75% contour lines without an error, we only need to increase the grid in order to cover all the contour lines. In this case, I will increase the grid at 50 (see the item # 5. Domain x <- seq(-50, 150, by=1.) y <- seq(-50, 150, by=1.))
1 2 3 4 5 6 7 8 9 10 11 12 13 14 15 16 17 18 19 20 21 22 23 24 25 26 27 28 29 30 31 32 33 | # 5. Domain x <- seq(-50, 150, by=1.) # resolution is the pixel size you desire y <- seq(-50, 150, by=1.) xy <- expand.grid(x=x,y=y) coordinates(xy) <- ~x+y gridded(xy) <- TRUE class(xy) # 6. Kernel Density kud_points <- kernelUD(points, h = "href", grid = xy) image(kud_points) # 7. Get the Volum vud_points <- getvolumeUD(kud_points) # 8. Get contour levels <- c(50, 75, 95) list <- vector(mode="list", length = 2) list[[1]] <- as.image.SpatialGridDataFrame(vud_points[[1]]) list[[2]] <- as.image.SpatialGridDataFrame(vud_points[[2]]) # 9. Plot par(mfrow = c(2, 1)) image(vud_points[[1]]) contour(list[[1]], add=TRUE, levels=levels) image(vud_points[[2]]) contour(list[[2]], add=TRUE, levels=levels) # 10. Get vertices (Will be an Error) vkde_points <- getverticeshr(kud_points, percent = 75, unin = 'm', unout='m2') plot(vkde_points) |


Now, all the contour lines are inside the grid, so we'll no see the error message. And that's all.
